Non-Accountant Friendly Financial Analysis
Your Numbers, Finally Explained
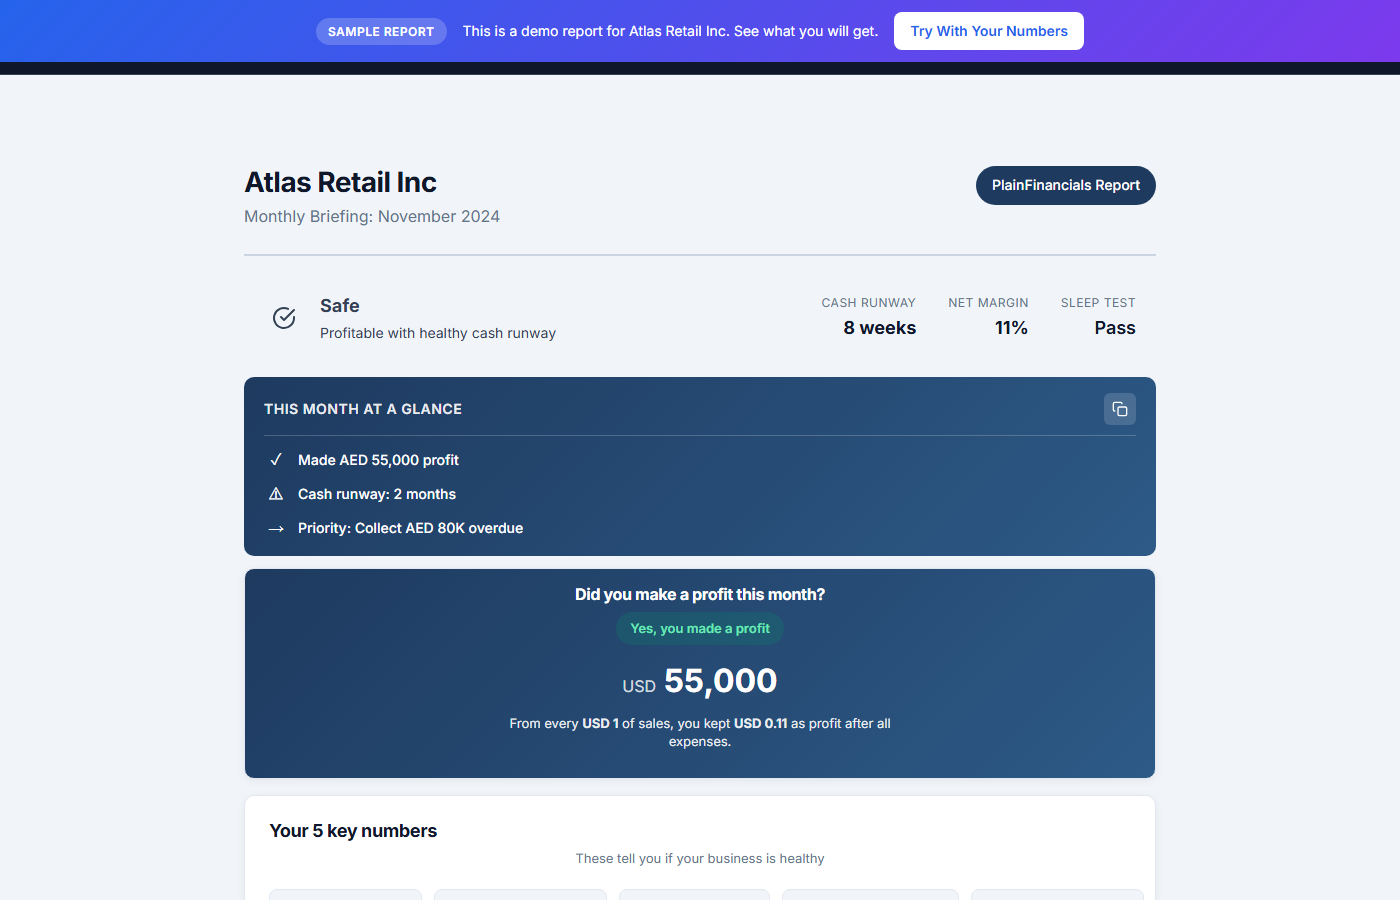
Financial reports translated into plain English. Finally understand your numbers.
11-section analysis
•
30-second results
•
Industry benchmarks included
"Good sales every month, but the cash was always gone. My accountant's reports never showed me why. This one pinpointed exactly where the money was leaking — and told me how to fix it."
Quick Burn Calculator
How many months of runway do you have?
$
$
$
Enter your numbers above